


Texts and tooltip texts for visualizations are managed in text lists and can be displayed in different languages. To switch a visualization between the available languages, configure a visualization element with the corresponding input configuration for changing the language.
There are static texts that are managed in “GlobalTextList” (generated automatically) and dynamic texts from created text lists. A dynamic text can be changed at runtime with a variable that defines the index of the text list entry. Static texts are fixed labels within a visualization; dynamic texts are often used for displaying variable values or error messages.
For creating and using text lists, see: ⮫ “Managing text in text lists”.
You can modify the appearance and formatting of texts and tooltips with the element properties “Text properties” and “Font variables”.
Configuring language switching for texts from text lists
Requirement: An empty visualization object is inserted into the project and it is open for editing in the visualization editor. There is also a “Visualization Manager” object. User management is not created for the visualization.
The following instructions provide a simplified example:
-
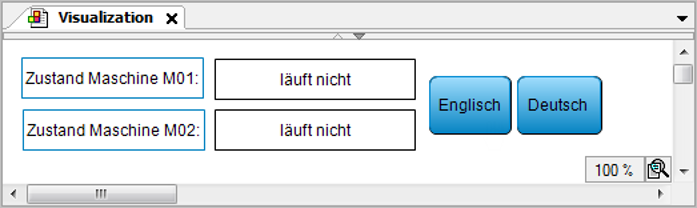
By means of two buttons, the user should be able to toggle the visualization texts between English and German.
-
Static texts in the visualization include the labels "State, Machine 01", "State, Machine 02", "English", and "German". These texts are located in the “GlobalTextList” in English and German.
Dynamic texts will describe the state of both machines. The texts are provided in the text list “Status_Texts” in English (
en) and German (de).
-
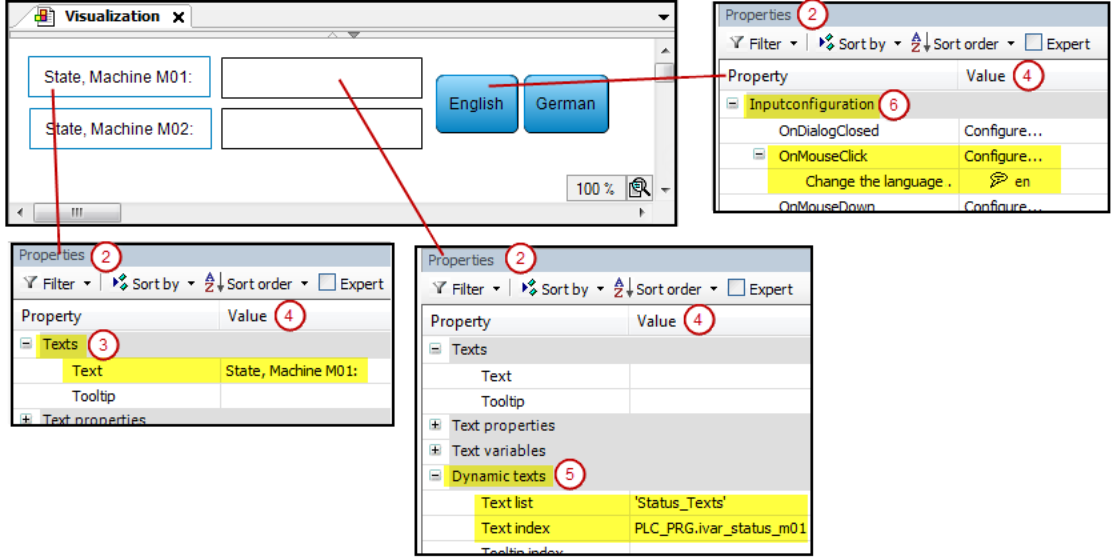
Drag a “Text Field” from the “Visualization Toolbox” view (“Common Controls” category) to the editor view. Specify the value
State, Machine M01in the properties editor for the element property “Texts Text”. -
Copy the element and change the copy label to
State, Machine M02. -
See also the figure in step 14 for the following steps.
Insert two elements of type “Button” from the “Visualization Toolbox” view (“Common Controls” category) in the visualization editor. With these elements, the user should be able to toggle the language of the visualization. Specify the text
GermanorEnglishin the properties editor for element property “Texts Text” (4). -
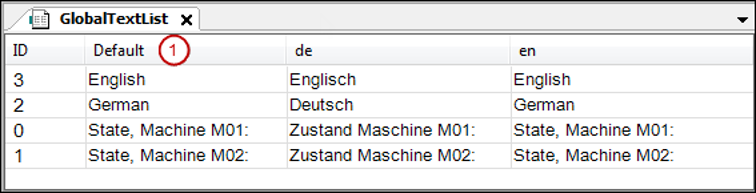
Double-click and open “GlobalTextList” in the “POUs” view.
The texts are entered in the “Standard” (1) column, and the “ID”s
0and1are assigned automatically as additional information. -
Add the languages “de” and “en” with the texts shown in the following figure.
-
Close the “GlobalTextList”.
-
Add two elements of type “Rectangle” from the “Visualization Toolbox” view (“Basic” category) in the visualization editor. The current state of each machine should be displayed.
-
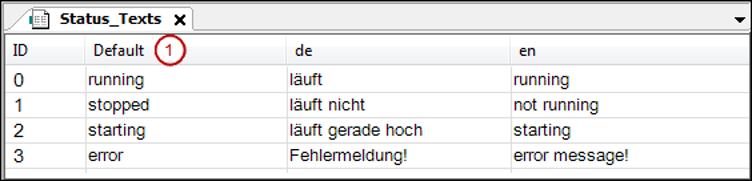
For managing the texts for describing the states, add an object of type “Text List” below the application. Name the list
Status_Texts. -
Specify the texts shown in the figure for the standard language (1) and the target languages “en” and “de” in the editor of “Status_Texts”.
-
Close the text list “Status_Texts”.
-
Select the rectangle element for displaying the state of machine M01. Select the text list
Status_Textsfrom the combo box in the properties editor (2) for the “Dynamic texts” element property (5). Specify an application variable for “Text index” that shows the appropriate text index for the state of the machine at runtime. Example:PLC_PRG.ivar_status_m01. -
Now configure the user input for both buttons for toggling the language in the visualization.
Select the "German" button. Double-click “Configure” of the property “Input configuration” (6), “OnMouseClick”.
The “Input configuration / OnMouseClick” dialog opens.
-
Select “Change the language” on the left. Click the arrows to accept the setting to the right. Select “de” in “Language” to the right of the dialog in the
 input assistance. Click “OK” to confirm.
 -
In the same way, configure the entry for the second button:
English: “Text list”:Status_Texts, “Text index”:3, “Change the language”: English).The following figure shows the performed properties configurations for the four visualization elements.
-
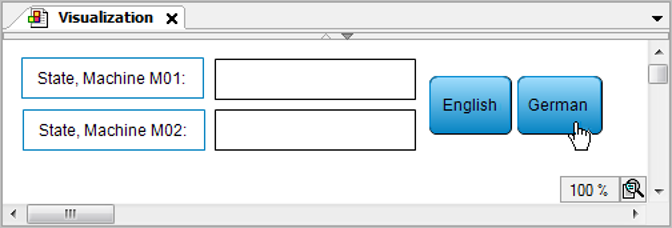
When the application is compiled without errors, you can test the visualization in simulation mode. Activate the option “Online Simulation”. Click “Online Login”.
The visualization appears in the visualization editor view in online mode:
-
Click the “German” button.
The language changes to German:
Setting up fonts for a language
The font for a visualization element is defined in the properties editor. If a language switch is provided, you can overwrite this basic font with another font for each language in the visualization manager.
Requirement: A visualization is set up with at least one language in addition to the default language.
-
Double-click and open the “Visualization Manager” object and select the “Font” tab.
-
Double-click the field in the “Font” line for a particular language. Select a font from the combo box.
-
In the “Font size” line, replace the value
1with a value greater than 1 (example:2) in order to increase the size of the font as defined by the visualization style; or replace it with a value less than 1 in order to decrease is (example: 0.5).In online mode, the font changes depending on the set language.