Symbol: 
An object of type “Trace” is used to configure and display application-specific trace data in one or more charts. At application runtime, value curves of trace variables, which you can monitor in the trace editor in CODESYS during this time, are recorded on the controller. Requirements are that a trace configuration has been configured transferred to the controller, and the trace recording has been started. The sampled data is transmitted to the development system and displayed in charts according to the configuration. You can navigate through the data when tracing.
For more information see: ⮫ “Data Sampling with Trace ”
If the controller supports a Trace Manager, then you can use the '⮫ DeviceTrace' object type in the Trace Manager to access all traces that are running on the controller.
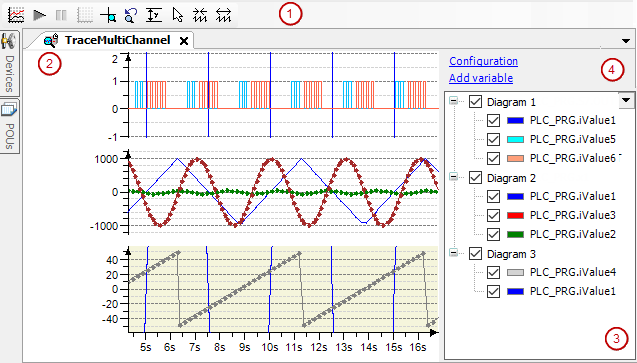
Double clicking the trace object opens the trace editor. The corresponding toolbar contains the most important trace commands. The trace variable list shows the variable whose value curve is recorded.

-
(1): Toolbar of the trace editor
-
(2): Trace editor
-
(3): Trace variable list
-
(4): Links for trace configuration
“Configuration”
“Add Variable”
-
See also: ⮫ Trace Configuration
-
Toolbar of the trace editor
-
Trace editor
-
Trace variable list
-
Navigating in the trace diagram


