A visualization is a raster image in pixels. The pixel position is specified in X/Y-coordinates. The origin (0,0) is located at the upper left corner of the window. The positive X-values run to the right, and the positive Y-values run downwards. The position of an element on the Z-axis of the visualization is controlled by the position in the element list (see below).
Configuring the size and position in the editor
The size and position of an element are specified as pixel coordinates in the “Properties” view. These settings are displayed graphically in the editor view at the same time.
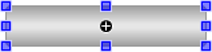
When you drag a visualization element from the “Visualization Toolbox” view to the editor view, it is shown as selected, as in the following example of a rectangle element:
The possible positions depend on the set grid. You can change its settings CODESYS options. Commands in the context menu are available for alignment and grouping.
Now you can move or resize the element directly in the editor. As an alternative, you configure the “Position” property in the properties editor, which opens automatically for the selected element. See the description for this, for example in the help page for the “Button” element. The changes are also updated in the other editor.
Changing the element size and position in the editor
-
Focus the element so that the shape of the mouse pointer indicates movement (example:
 ).
). -
Drag the element to any position.
The position of the element is also updated in the properties “Position X” and “Position Y ”.
-
Focus on a blue box.
The shape of the mouse pointer is a double arrow that indicates the direction you can drag the box in order to resize the box:
 .
. -
Drag the blue box to resize the element.
The position of the element is also updated in the properties “Position X” and “Position Y ”.
Moreover, you can rotate the “Rectangle”, “Line”, “Polygon”, and “Pie” elements.
Static rotation of rectangle, line, polygon, pie, or image
-
Select the element for static rotation. Example: Rectangle
The rectangle is displayed with a handle next to the movable position boxes.
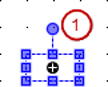
(1) Handle
-
Drag the mouse pointer over the handle.
The cursor is displayed as a rotating arrow
 .
. -
Rotate the element to any position.

In the property “Position Angle”, the set angle is displayed in degrees.
Moving the visualization element forward and back
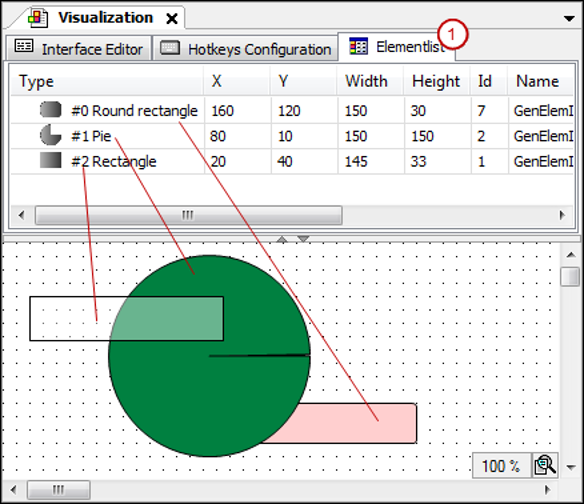
Each visualization element is in its own layer of the visualization (Z-axis). It can be hidden by other elements in the foreground and hide other elements in the background. The order of layers is visible on the “Element List” tab above the editor view. The order of elements from front to back specifies the order of visualization layers from back to front.
Use the commands from the “Order” context menu to move a selected element.
Example of an element list (1):