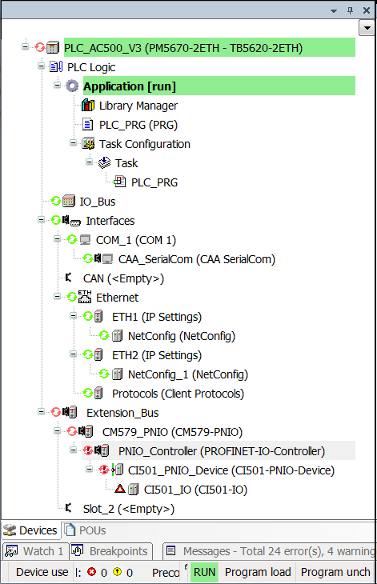
When Automation Builder enters the online mode internally, it shows the state of all configured communication modules.
The connection status can be recognized by a symbol in the device tree:
-
 Device without diagnosis messages
 -
 Device with diagnosis messages or device diagnosis is disabled ⮫ “Device diagnosis”
 -
 Device without diagnosis messages, but with diagnosis messages on at least one device
in the branch below
Device without diagnosis messages, but with diagnosis messages on at least one device
in the branch below
-
 Device with diagnosis messages and with diagnosis messages on at least one device
in the branch below
Device with diagnosis messages and with diagnosis messages on at least one device
in the branch below -
 Device is in offline mode
 -
 Device does not respond to identification message and
is not available for online connection
Device does not respond to identification message and
is not available for online connection
The identification is done in online mode.
-
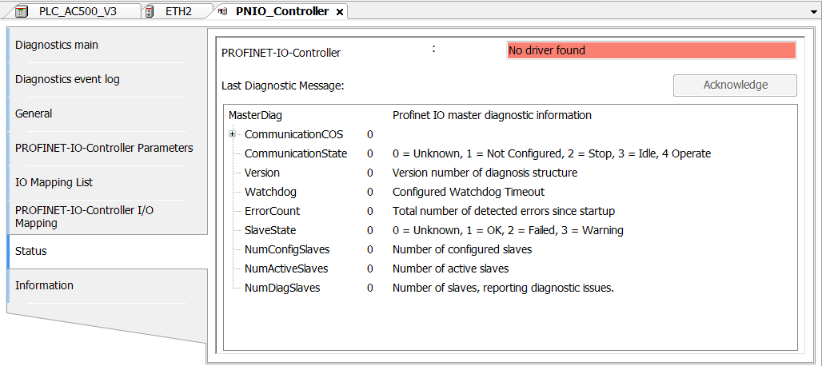
Double-click an element of the device-tree and select “Status” tab.
Diagnosis information will be available.
Diagnosis descriptions
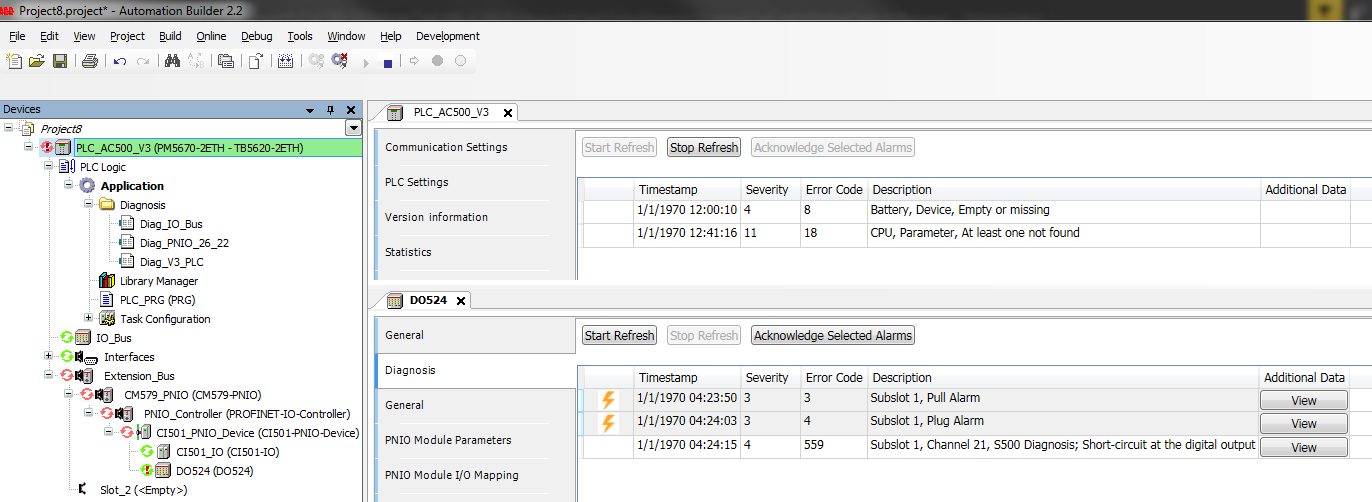
The user will be notified in the device tree with an exclamation mark beside the device having diagnosis messages. The diagnosis messages are provided in the “Diagnosis” tab.
Alarms will be presented with a thunderbolt in the first column of the diagnosis grid.
Acknowledging an alarm
-
Stop diagnosis refreshment by clicking [Stop refresh].
-
Select one or more alarms and click [Acknowledge selected alarms].
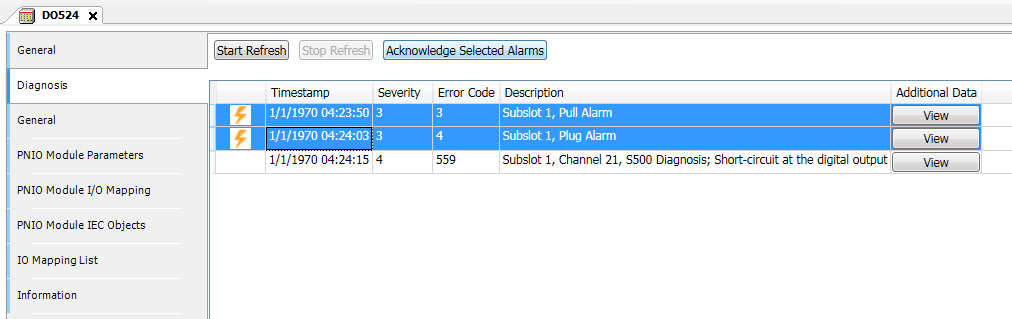
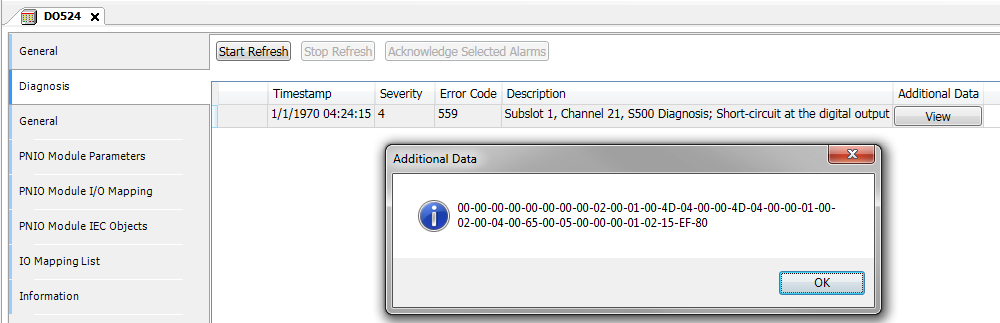
Some diagnosis messages contain additional data. Click [View] button to see the additional diagnosis (in hex) for further analysis. If [View] button is not available, no additional data is available for this diagnosis message.
You can copy the additional data to the clipboard with [CTRL] + [C].
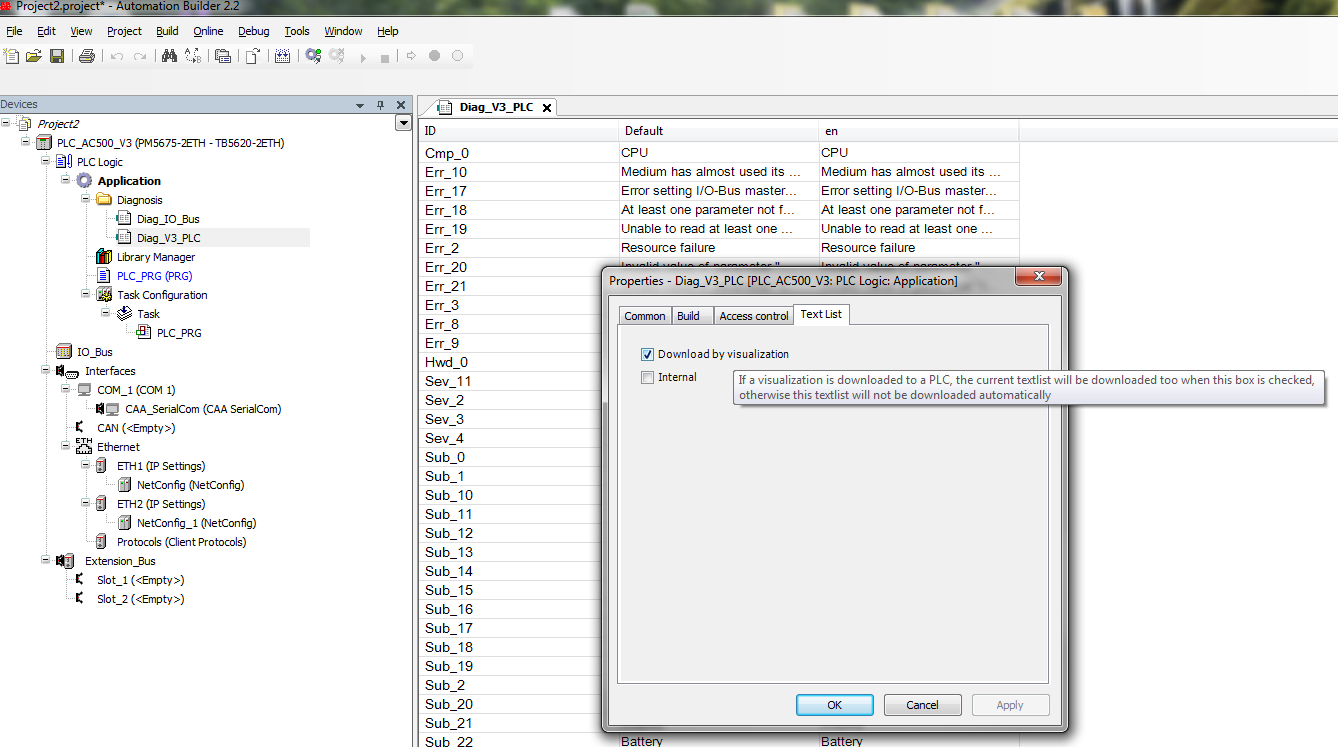
When building an IEC application in Automation Builder, diagnosis text lists will be generated and added to the device tree below the diagnosis folder. These text lists contain the device type specific diagnosis texts which are used by the diagnosis functions in the PLC application to show corresponding texts for error numbers.
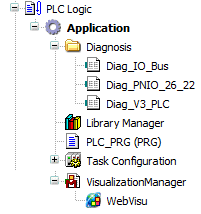
The diagnosis text lists will only be downloaded to the PLC when a visualization is present in the project.
The text lists will be downloaded automatically to the PLC with the visualization.
If there is a problem with downloading the text lists, make sure that the settings are correct:
-
Right-click on a text list and select “Properties”.
-
Open the “Text List” tab. The check box “Download by visualization” has to be selected.