


This tutorial demonstrates how to add visualizations to the project and link the elements of the visualization to the variables of the control program.
Preparation
This tutorial is based on the sample program RefigeratorControl, which was created in the "Your First Program in CODESYS" chapter. The finished program can also be found in the installation directory of
CODESYS, in the "Projects" subfolder.
See also
Creating the visualizations
The visualization consists of the following three visualization screens:
-
Visualization: Control elements and display of the refrigerator -
Diagnosis: History of the set and actual temperature, parameter settings -
Live Visu: Animation with refrigerator
-
Select the “Application” object in the device tree.
-
Click “Project Add Object Visualization”.
-
Specify
Live_Visuas the name. -
Create two more visualizations with the names
DiagnosisandVisualization.
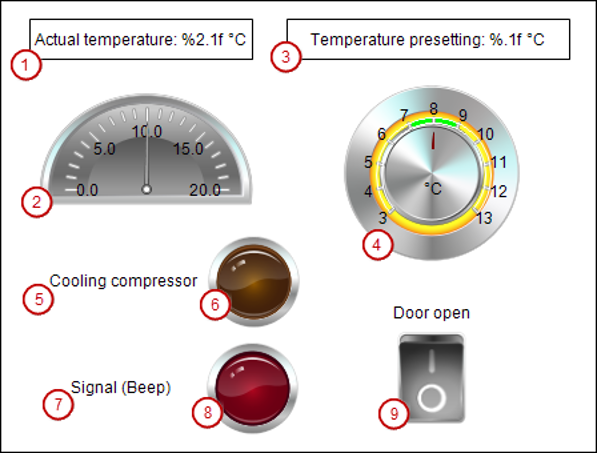
Structure of the visualization Visualization
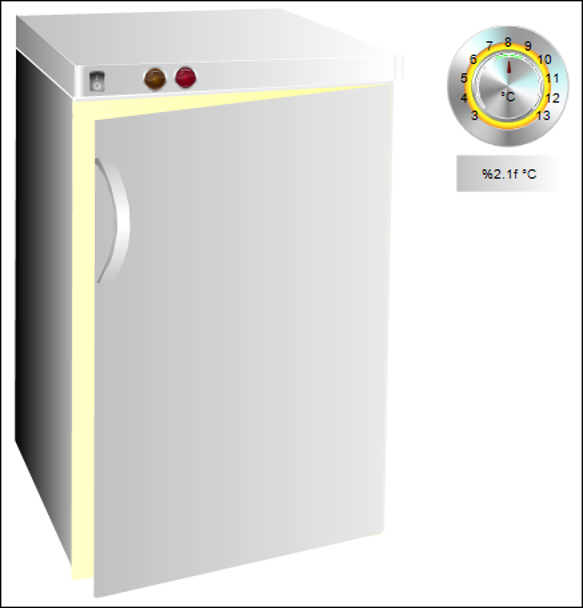
This screen consists of control and display elements that control the refrigerator.
-
(1) Numeric display of the actual temperature
-
(2) Pointer to display of the actual temperature
-
(3) Numeric display of the set temperature
-
(4) Potentiometer for setting the set temperature
-
(5) Label for compressor lamp
-
(6) Lamp for compressor on
-
(7) Label for signal lamp
-
(8) Lamp for signal "Close doors"
-
(9) Switch for opening and closing the refrigerator door
-
Open the visualization
Visualizationin the editor. -
Drag a “Rectangle” visualization element to the editor.
Change the following properties
-
“Texts Text”:
Actual temperature: %2.1f °C -
“Text variables Text variable”:
Glob_Var.rTempActual
-
-
Drag a “Meter 180°” visualization element to the editor.
Change the following properties
-
“Value”:
Glob_Var.rTempActual -
“Scale Scale end”: 20
-
“Scale Main scale”: 5
-
“Scale Subscale”: 1
-
-
Drag a “Rectangle” visualization element to the editor.
Change the following properties
-
“Texts Text”:
Temperature presetting: %.1f °C -
“Text variables Text variable”:
Glob_Var.rTempSet
-
-
Drag a “Potentiometer” visualization element to the editor.
Change the following properties
-
“Variable”:
Glob_Var.rTempSet -
“Background Background color”: “yellow”
-
“Pointer Color”: “red”
-
“Scale Subscale position”: “Outward”
-
“Scale Scale start”: 3
-
“Scale Scale end”: 13
-
“Scale Subscale”: 1
-
“Scale Main scale”: 1
-
“Label Unit”: °C
-
“Label Scale format (C syntax)”: %.0f
-
“Label Max. text width of labels”: 21
-
“Label Height of labels”:15
-
-
Drag a “Label” visualization element to the editor.
Change the following properties
-
“Texts Text”:
Cooling compressor
-
-
Drag a “Lamp” visualization element to the editor. Position it behind the text
Cooling compressor.Change the following properties
-
“Variable”:
Glob_Var.bCompressor
-
-
Drag a “Label” visualization element to the editor.
Change the following properties
-
“Texts Text”:
Signal (beep)
-
-
Drag a “Lamp” visualization element to the editor. Position it behind the text "Signal (beep)".
Change the following properties
-
“Variable”:
Glob_Var.bSignal -
“Background Image”:
Red
-
-
Drag a “Rectangle” visualization element to the editor.
Change the following properties
-
“Texts Text”:
Door open
-
-
Drag a “Rocker Switch” visualization element to the editor.
Change the following properties
-
“Variable”:
Glob_Var.rDoorOpen
-
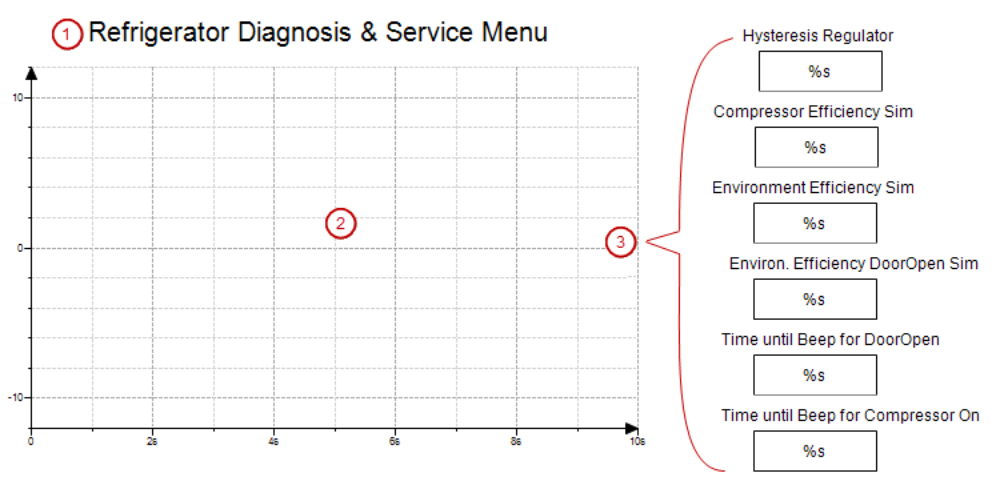
Structure of the visualization Diagnosis
In this screen, you can monitor the temperature curve and optimize the parameters.
-
(1) “Label” elements for the heading
-
(2) “Trace” element for displaying the temperature curve
-
(3) “Rectangle” elements for displaying the values
-
Open the visualization
Diagnosisin the editor. -
Drag a “Label” visualization element to the editor.
Change the following properties
-
“Texts Text”: Refrigerator Diagnosis & Service Menu
-
“Text properties Font”: Arial, Standard, 18
-
-
Drag a “Trace” visualization element to the editor.
-
Click the
Diagnosis_Trace1value of the “Trace” property.The “Trace Configuration” dialog opens.
-
Select the “MainTask” in “Task”.
-
Click the “Add Variable” link.
A variable is added to the trace. The variable settings are displayed in the dialog.
-
Select
Glob_Var.bCompressorfor the variable. -
Add the
Glob_Var.rTempSetandGlob_Var.rTempActualvariables to the trace. For the other settings, you can use the default values. -
Click “OK” to exit the dialog.
-
Drag a “Rectangle” visualization element to the editor. Position it on he right next to the trace element.
Change the following properties
-
“Texts Text”: %s
-
“Text variables Text variable”: PLC_PRG.rHysteresis
-
-
Configure the “OnMouseDown” input configuration of the element. Click “Input configuration OnMouseDown Configure”.
The “Input Configuration” dialog opens.
-
Assign the “Write Variable” command to the action. Accept the default values and click “OK”.
-
Drag a “Label” visualization element to the editor. Position it over the first rectangle.
Change the following properties
-
“Texts Text”: Hysteresis Regulator
-
-
Adjust the size and position of both elements.
-
Select both of the “Rectangle” and “Label” elements and duplicate them by means of copy and paste.
-
Adjust the labels and variables of the copied elements.
-
“Text”:
Compressor Efficiency, “Text variable”:Simulation.P_Cooling -
“Text”:
Environment Efficiency, “Text variable”:Simulation.P_Environment -
“Text”:
Environ. Efficiency DoorOpen Sim, “Text variable”:Simulation.P_EnvironmentDoorOpen -
“Text”:
Time until Beep for DoorOpen, “Text variable”:Glob_Var.timDoorOpenThreshold -
“Text”:
Time until Beep for Compressor On, “Text variable”:Glob_Var.timAlarmThreshold
-
See also
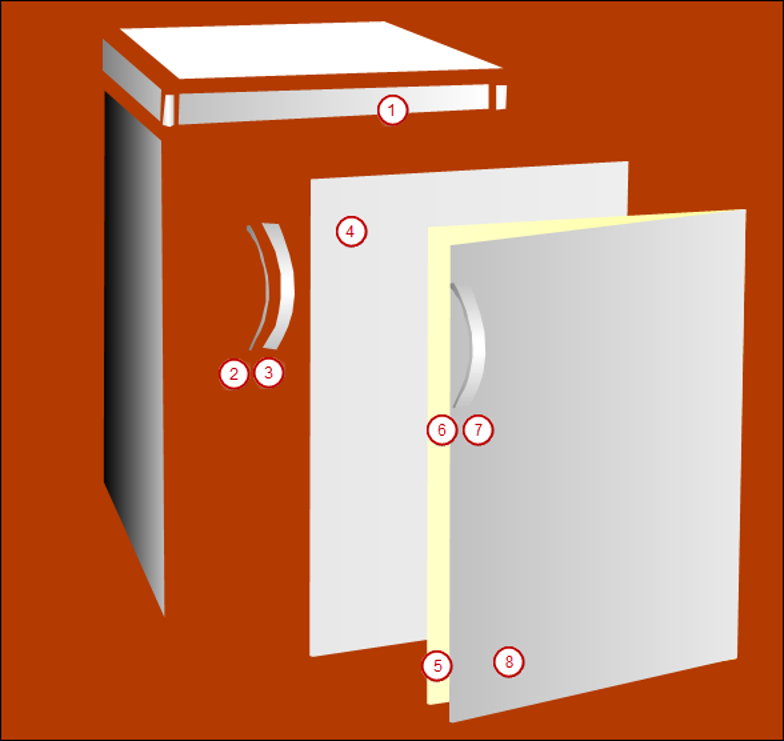
Structure of the visualization 'Live Visu'
This screen includes the representation of a refrigerator. The refrigerator consists of several polygon type visualization elements. The doors of the refrigerator are drawn in both the closed and open states. Both doors consist of a group of single elements.
-
Open the
Live_Visuvisualization in the editor. -
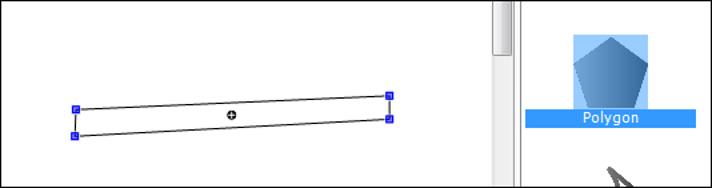
Select the “Polygon” visualization element in the “Visualization Toolbox” view.
-
Click several times in the editor to create a surface. Right-click to stop adding corner marks.
-
Move the corner marks to the required position so that the element (1) is formed.
-
Select the element.
Change the following properties:
-
“Colors Use gradient color”:

-
“Appearance Line style”: “Invisible”
-
-
Click the “Colors Use gradient color” property.
-
Select the color “Gray” for “Color 1” in the “Gradient Editor” dialog.
-
Create all other elements with the “Polygon” visualization element.
-
Group the elements of the closed doors (2+3+4) and the open doors (5+6+7+8). To do this, press the [Shift] key and click “Visualization Group” to select the elements.
-
Move the elements together so that the completed refrigerator is formed. Position the open doors precisely on the closed doors.
-
Select the "Open doors" group.
-
In the properties, double-click the input field “State variable Invisible”.
-
Press [F2] to open the Input Assistant.
-
Select the
rDoorOpenvariable in the “Variables” category (below “Application Glob_Var”). -
Negate the variable with
NOT(--> NOT Glob_Var.rDoorOpen).If the
rDoorOpenvariable is FALSE (door is closed), then the element is invisible. Then the underlying doors are visible. -
Copy the following elements from the
Visualizationscreen:-
Potentiometer for setting the temperature
-
Rectangle for displaying the set temperature
-
Door openswitch -
Cooling compressorlamp -
Signal (beep)lamp
-
-
Insert the elements from the clipboard to the
Live_Visuvisualization screen. -
Reduce the elements and position them on the refrigerator.
Visualization in online mode (simulation)
When the visualization is complete, test it in simulation mode.
-
Click “Online Simulation”.
-
Click “Online Login”.
A dialog opens and prompts you to create and download the application.
-
Click “Yes” to confirm the dialog.
-
Click “Debug Start”.
-
Open the visualization
Live_Visuin the editor.The refrigerator is in online mode.
-
Open the doors with the switch and monitor the temperature and the alarms. Change the parameters in the screen
Diagnosisand watch the reaction in the temperature curve.