


Symbol:

Category: “Special Controls”
The element displays the curve of variable values as a trend diagram. The trend diagram is suitable for representing a long-term data curve because the data is read from a trend recording and hence from a database. Moreover, you can run the “Trend” element together with the “Date Range Picker”, “Legend”, and “Time Range Picker” operating elements so that the user can navigate conveniently in the diagram.
You can programmatically delete the recorded trend curve at runtime. The recording starts again from the time of deletion. See the help page for "Programming a Trend Visualization".
Element properties
|
“Element name” |
Example: |
|
“Data source” |
Data source for the connection via the device and the application to the “Trend Recording” object where the trend data that you want to show was saved. If the “Trend Recording” object is on the local device, then it is sufficient when you specify the respective application. If the trend recording is on a remote device, then you need to specify the data source connection to this device.
|
|
“Type of element” |
“Trend” |
|
“Trend recording” |
The trend recording is located on the device specified in the “Data source” property. |
|
“Display Mode” |
|


 : Trend recording whose data is displayed as a diagram
 : Opens the
 Element property 'Position'
The position defines the location and size of the element in the visualization window. This is based on the Cartesian coordinate system. The origin is located at the upper left corner of the window. The positive horizontal x-axis runs to the right. The positive vertical y-axis runs downwards.
|
“X” |
The x-coordinate of the upper left corner of the element Specified in pixels Example: |
|
“Y” |
The y-coordinate of the upper left corner of the element Specified in pixels Example: |
|
“Width” |
Specified in pixels Example: |
|
“Height” |
Specified in pixels Example: |
|
Tip: You can change the values in “X”, “Y”, “Width”, and “Height” by dragging the corresponding symbols |
|
|
“Angle” |
Static angle of rotation (in degrees) Example: The element is displayed rotated in the editor. The point of rotation is the center of the element. A positive value rotates clockwise. Tip: You can change the value in the editor by focusing the element to the handle.
When the cursor is displayed as a rotating arrow 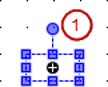 (1): Handle Note: If a dynamic angle of rotation is also configured in the property “Absolute movement Internal rotation”, then the static and dynamic angles of rotation are added in runtime mode. The static angle of rotation acts as an offset. |
 to another position in the editor.
 , you can rotate the element about its center as a handle.
|
“Show cursor” |
Behavior at runtime: As soon as the graph is drawn, the user can move the cursor along the time axis in order to mark a specific time. Then the variable value belonging to the cursor position is displayed in the legend above the graph. 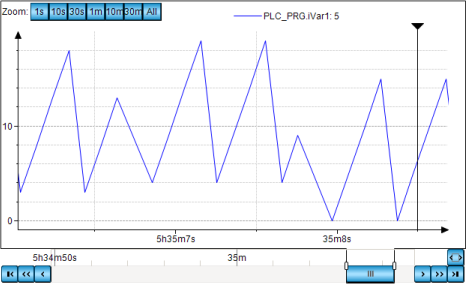 |
|
“Show tooltip” |
Requirement: “Show cursor” is activated.
Behavior at runtime: The variable value belonging to the cursor position is displayed as a tooltip. |
|
“Show frame” |
|
|
“Number format” |
Format specification in printf syntax, which determines how the values are displayed in the tooltip and in the legend Example: |
 : A cursor (black triangle with vertical line) is shown in the trend diagram.
 Element property 'Tick mark labels'
The time stored in the trend recording are in the UTC time zone. If the time is displayed in the trend of the visualization element, then the time stamps are converted to the local time zone of the operating system of the PLC.
Change the time zone in the operating system if the times in the trend diagram are not in the zone that you need.
|
“Time stamps” |
X-value of the trend diagram
|
|
“Draw labels on two lines” |
|
|
“ Omit irrelevant information in timestamps” |
|
|
“Internationalization (format strings)” |
Format specification for the date and time display of the time stamp (when it is displayed in full) Note: The property is visible only if the “Omit irrelevant information in timestamps” option is not selected. |
|
“Date” |
Format string that returns the date display according to the defined format. The operating system locale is used as the default setting. Defined format strings for the date:
Example:
|
|
“Time” |
Format string that returns the time (or time of day) display according to the defined format. The operating system locale is used as the default setting. Defined format strings for the time:
Example:
|
 : The time stamp is displayed on one line. Example:
 Element property 'Assigned control elements'
These elements are created automatically when the control elements are added with the command “Insert elements for controlling Trend”.
|
“Date Range Picker” |
Control element for changing the date and time of the displayed data sets. With |
|
“Time Range Picker” |
Control element for changing the time of the displayed data sets. With |
|
“Legend” |
Control element for displaying a legend for the graphs. With |
 , all elements are provided that have implemented the interface
 Element property 'Center'
The properties contain fixed values for the coordinates of the point of rotation.
This point of rotation is shown as the  symbol. The point is used as the center for rotating and scaling.
|
“X” |
X-coordinate of the point of rotation |
|
“Y” |
Y-coordinate of the point of rotation |
You can also change the values by dragging the symbols () to other positions in the editor.
Element property 'Absolute movement'
The properties contain IEC variables for controlling the position of the element dynamically. The reference point is the upper left corner of the element. In runtime mode, the entire element is moved.
|
“Movement” |
||
|
“X” |
Variable (numeric data type). Defines the X position (in pixels). Example: Increasing this value in runtime mode moves the element to the right. |
|
|
“Y” |
Variable (numeric data type). Defines the Y position (in pixels). Example: Increasing this value in runtime mode moves the element downwards. |
|
|
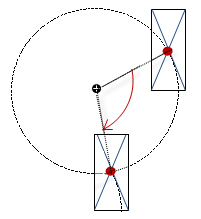
“Rotation” |
Variable (numeric data type). Defines the angle of rotation (in degrees). Example: The midpoint of the element rotates at the “Center” point. This rotation point is shown as the In runtime mode, the alignment of the element remains the same with respect to the coordinate system of the visualization. Increasing the value rotates the element to the right. |
 |
|
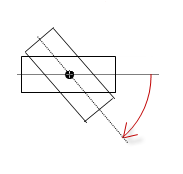
“Interior rotation” |
Variable (numeric data type). Defines the angle of rotation (in degrees). Example: In runtime mode, the element rotates about the point of rotation specified in “Center” according to the value of the variable. In addition, the alignment of the element rotates according to the coordinate system of the visualization. Increasing the value in the code rotates clockwise. The rotation point is shown as the Note: If a static angle of rotation is specified in the “Position Angle” property, then the static angle of rotation is added to the variable angle of rotation (offset) when the visualization is executed. |
 |
You can link the variables to a unit conversion.
The “X”, “Y”, “Rotation”, and “Interior rotation” properties are supported by the "Client Animation" functionality.
See also
Element property 'State variables'
The variables control the element behavior dynamically.
|
“Invisible” |
Variable (
|
The “Invisible” property is supported by the "Client Animation" functionality.
These properties are available only when you have selected the “Support client animations and overlay of native elements” option in the Visualization Manager.
|
“Animation duration” |
Defines the duration (in milliseconds) in which the element runs an animation
Animatable properties
The animated movement is executed when at least one value of an animatable property has changed. The movement then executed is not jerky, but is smooth within the specified animation duration. The visualization element travels to the specified position while rotating dynamically. The transitions are smooth. |
|
“Move to foreground” |
Moves the visualization element to the foreground Variable ( Example:
|
Element property 'Access rights'
Requirement: User management is set up for the visualization.
|
“Access rights” |
Opens the “Access rights” dialog. There you can edit the access privileges for the element. Status messages:
|
See also