

A “Trend” visualizes data which is used in the database of a trend recording. In contrast to the “Trace” element, the “Trend” element is particularly suitable for long-term data sampling.
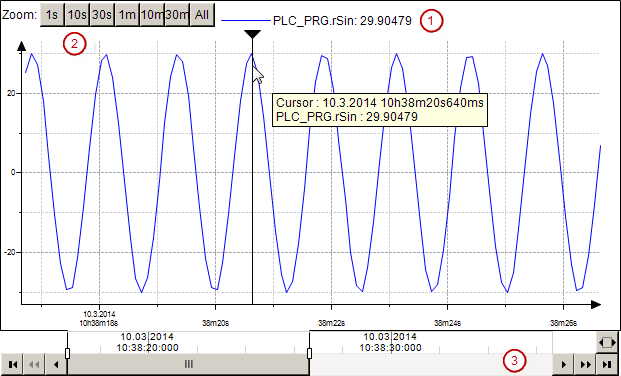
The visualization of a trend encompasses the “Trend” element and the controls. The three possible controls can be seen in the illustration.
-
“Legend” ①: Outputs the trend variables with values.
-
“Time Range Picker” ②: Provides buttons for selecting predefined time ranges.
-
“Date Range Picker” ③: Encompasses controls for navigation and zooming in the historical and current data on basis of the set date range.
A cursor is optionally available that enables the reading of a value at a certain time.
You can display a trend visualization in the following clients:
-
Target Visualization
-
HMI: Communication is made via a data source manager.
-
Integrated visualization