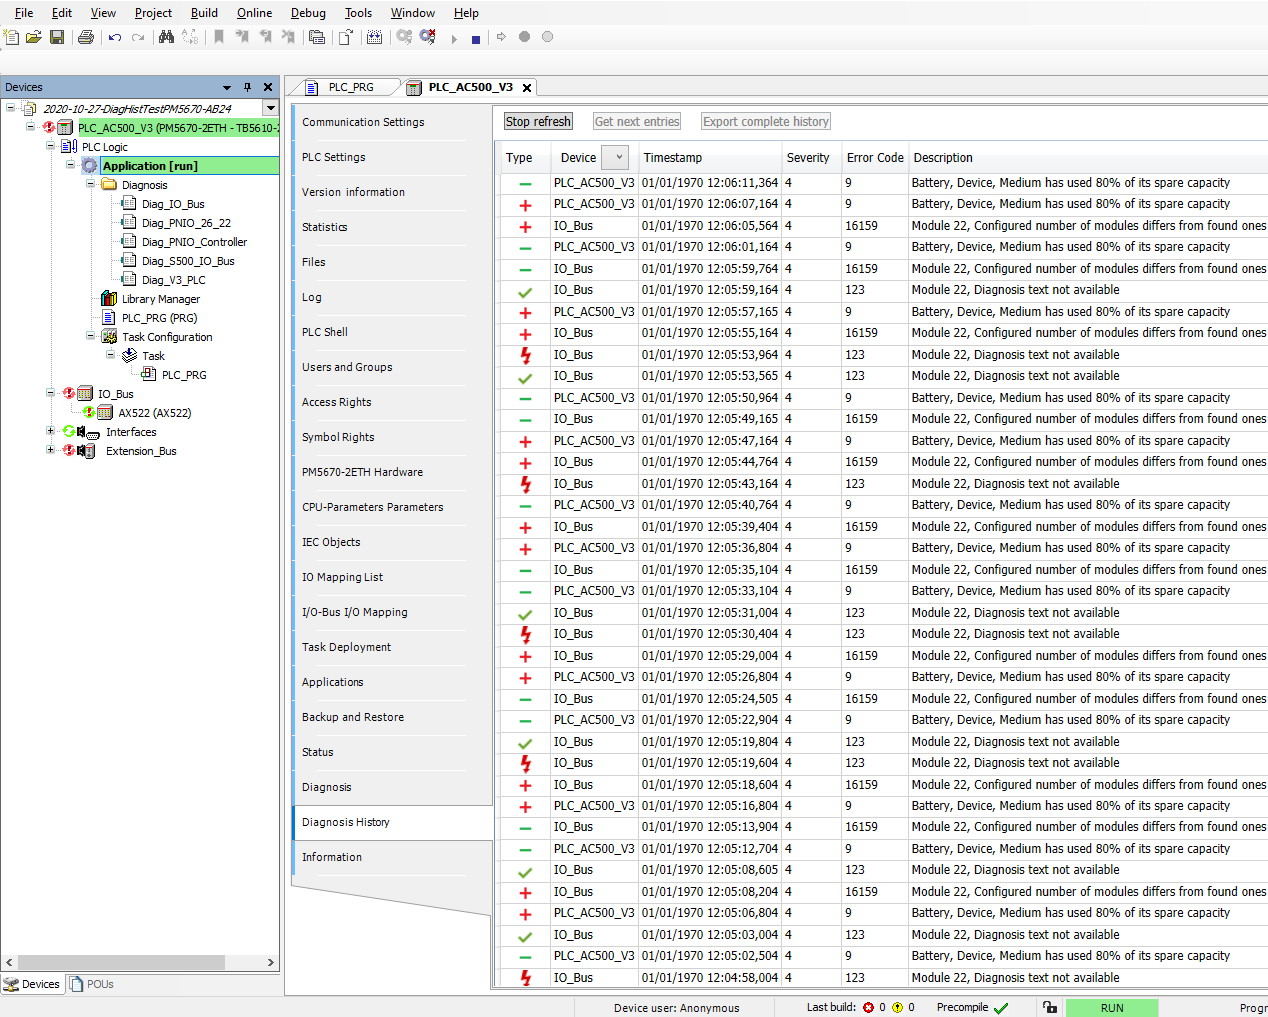
The 'Diagnosis History' view provides an overview of the current and past system events that resulted in a diagnosis event.
-
Incoming diagnosis events are indicated with
 .
. After the problem that causes a diagnosis event has been resolved, this diagnosis event is indicated automatically with
 .
. -
Alarm events, e.g. PROFINET alarm are indicated with
 .
.In the 'Diagnosis' view the user can acknowledge an alarm. Note that an alarm event can be acknowledged though the problem that causes the alarm still persists.
The acknowledge action is indicated with
 on the concerning event entry. If the icon changes to
  , the acknowledge action has been completed by the PLC.
The following buttons are available in the 'Diagnosis History' view:
-
Start/Stop refresh:
Enables or disables the automatic refresh mode. In refresh mode new diagnosis events will be displayed automatically. Only the last 100 entries are shown in this view, the latest events on top of the list.
-
Get next entries:
Adds the previous (older) 100 diagnosis events at the bottom of the list.
-
Export complete history:
Creates a csv file with all events from the diagnosis history (not only the visible ones).