The visualization displays a histogram with bars all the same color (example: green).
Now you want the bars with values less than 30, for example, to be displayed in another color (example: red).
-
Select the “Colors Alarm color” element property.
-
Specify the limiting value in “Alarm value” above or below which the bars should be displayed in another color.
-
Select “More” from the list box in “Alarm condition” if all values greater than the “Alarm value” should be displayed in another color. Otherwise, select “Less”.
-
Select an “Alarm color” (example: “Red”).
-
Click “Build Generate Code”.
-
If the project has been compiled without errors, then click “Online Login” and click “Debug Start” to start the application.
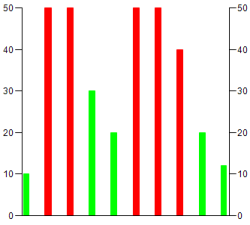
In the example histogram, all bars with values greater than
30are displayed in red.