When you execute a trend, it is best to proceed with user guidance and the help of the trend wizard.
Development of a visualization with trend
-
Create an empty standard project and program at least one variable into
PLC_PRG.PLC_PRGis declared and implemented -
Add the “Visualization” object to the device tree below “Application”.
An empty visualization appears.
-
Open “ToolBox Special Controls”.
-
Drag the “Trend” element to the visualization
The “Trend Recording” dialog with the “Record Settings” opens.
-
Select the task in which the trend recording will be executed.
In general the trend recording runs in the same task as the main program, i.e. PLC_PRG.
Therefore, select
MainTask. -
Add a trend variable with “Add Variable” and assign an IEC variable from PLC_PRG to the trend variable.
-
Click “OK” to close the “Trend Configuration”.
There is a recently created "Trend Recording" object below the “Trend Recording Manager”. The active visualization contains a “Trend” element that is selected.
-
Click “Visualization Insert elements for controlling trend elements”.
The “Trend Wizard” dialog opens.
-
By default, all three controls are activated in the dialog. Click “OK” to exit the dialog.
The active visualization contains a trend with controls.
-
Set the application containing the trend objects to active.
-
Compile the application with [F11].
-
Execute the “Online Login” command.
-
Start the application with [F5].
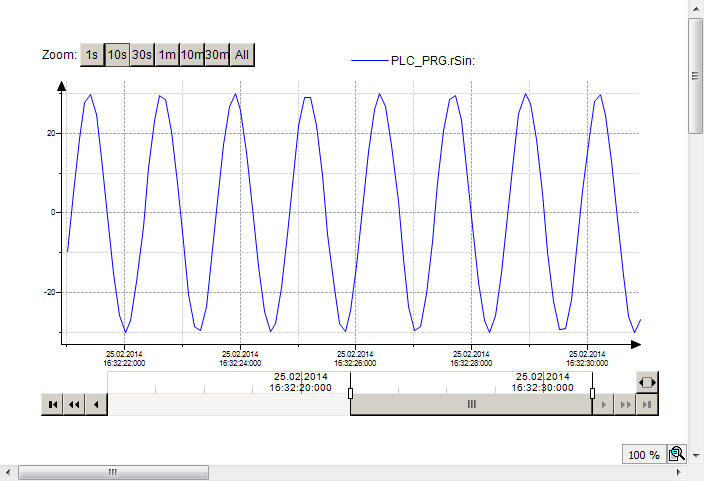
The target visualization appears. The visualization contains the trend diagram with the value curve of the variable. The controls enable user inputs.
Visualization of the sinusoidal trend of an IEC variable
The following objects are implemented in the project:
-
PLC_PRG -
Visualization_Trend1 -
VisuWithTrend
The PLC_PRG program runs as part of the application on the controller.
PROGRAM PLC_PRG
VAR
    iVar : INT;
    rSin : REAL;
    rVar : REAL;
END_VAR
iVar := iVar + 1;
iVar := iVar MOD 33;
rVar := rVar + 0.1;
rSin := 30 * SIN(rVar);
Visualization_Trend1
Visualization_Trend1 is the object that contains the configuration of the trend recording.
VisuWithTrend
VisuWithTrend is the object that displays the trend.
The visualization contains four elements: one “Trend” and three controls. The properties of the trend are defined as follows.
|
Properties |
Value |
|---|---|
|
“Trend recording” |
Visualization_Trend1 |
|
“Show cursor” |
 |
|
“Show tooltip” |
|
|
“Show frame” |
|
|
“Date Range Picker” |
|
|
“Time Picker” |
|
|
“Legend” |
|
 : Trend1DateRangeSelector
 : Trend1TimeSelector
 : Trend1Legend
VisuWithTrend at runtime