A frequently required function of a user interface is the display of data arrays. CODESYS Visualization provides the “Table” element for this purpose.
In the configuration of the “Table” element, you specify an array variable in the “Data array” property. The array elements are displayed in the rows and columns of the table.
Subsequent instructions describe an example of how an array of a structure is displayed
in a table. As a preparation, create the MYSTRUCT DUT and the declarations in the PLC_PRG program.
TYPE MYSTRUCT :
STRUCT
    iNo : INT;
    bOnStock : BOOL;
    strPartNumber : STRING;
END_STRUCT
END_TYPE

PROGRAM PLC_PRG
VAR
    arrStruct : ARRAY[0..6] OF MYSTRUCT;
    iSelectedColumn : INT;
END_VAR
-
Drag the “Table” visualization element to the visualization editor.
-
Assign the array variable
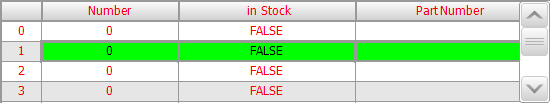
arrStructto the “Data array” property.The structure members are displayed as column headings and the array index as row headings.
-
Change the “Columns Column [0] Column header” property to an informative heading (example:
Number). -
Change the heading of column [1] to
in stockand column [2] toPart number. Adjust the column width. -
Assign a color to the “Selection Selection color” property.
-
Define the “Selection Selection type” property as
Row selection. -
In the “Selection Variable for selected row” property, define the
PLC_PRG.iSelectedColumnvariable.The following display results in online mode: