


Requirement: The PLC device supports the Trace Manager. For the example described here it is PM5680-2ETH. The device provides traces of the individual cores for CPU loads, as well as traces of the PLC load.
-
In the project, define the “Communication Settings” for the controller.
-
Select the PLC entry in the device tree and add a “DeviceTrace” object.
-
Rename “DeviceTrace” to "Trace_PlcLoad" (“Properties”).
-
Set the focus in the trace editor and click “Trace Upload Trace”.
The connection to the controller is established and the “Online List” dialog opens.
-
In the dialog, select the “PlcLoad” entry and click “Upload and close dialog”.
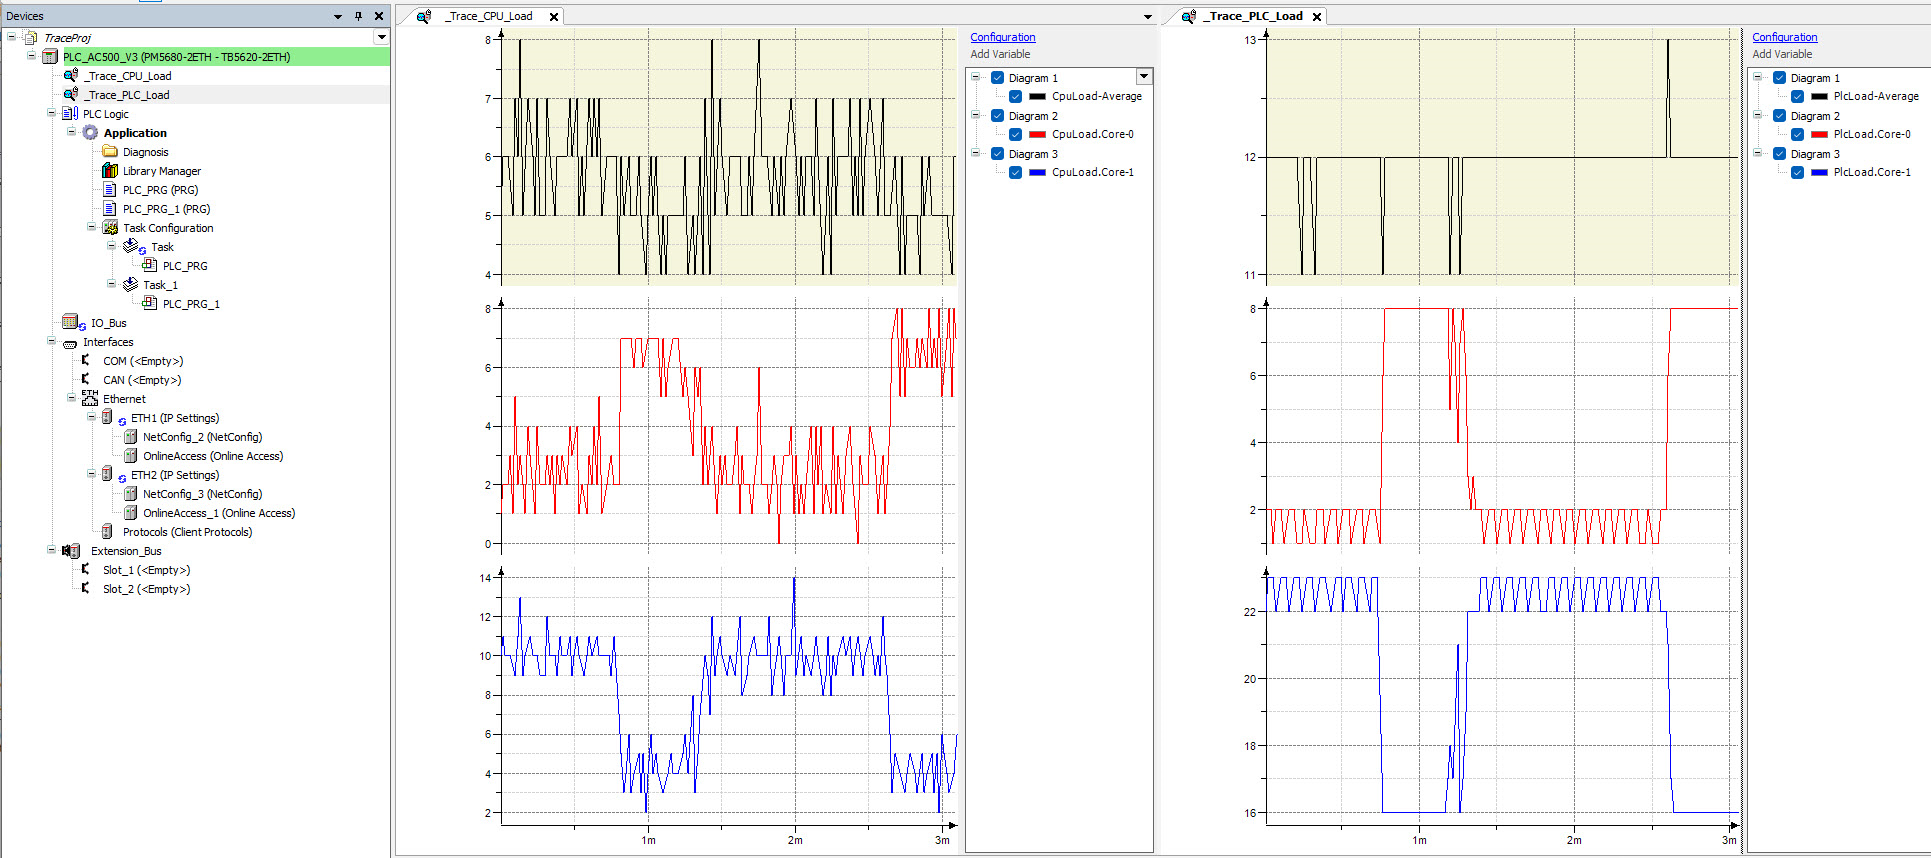
Multiple trace views open in the trace editor to show the PLC load in the runtime. These are the traces for the individual cores and a trace for the average value. The following text appears for each: "No samples have been recorded."
Multiple trace views open in the trace editor to show the CPU load in the runtime. These are the traces for the individual CPUs and a trace for the average value. The following text appears for each: "No samples have been recorded."
-
Click “Trace Start Trace”.
The trace record for the parameters is displayed.
-
If you also want to display the traces for the
CpuLoadper CPU with their average value in the project, then insert another “DeviceTrace” object into the device tree. Name it "Trace_CpuLoad", for example. Load and start the traces for “CpuLoad” in the editor as described above.Now you can monitor all traces in the project:
-
If you want to change the appearance of the presentation, then click “Configuration” in the respective trace editor window to access the configuration dialogs. You can use these dialogs (except variable assignments) in the same way as for an IEC variable trace created in a project.
-
To disconnect from the controller, close all open DeviceTrace editor windows. If you are logged in to the device, then logging out is enough to terminate the connection.