


You can step through an application and navigate the code. This is useful to check the status of your code at runtime. You can examine the call process, track variable values, or locate errors.
Stepping commands are provided in the “Debug” menu for this purpose. The commands become available when you set breakpoints in
online mode and then halt execution at a breakpoint: the application is in “HALT ON BP” state (debug mode). During debug mode, the current break position is highlighted
in yellow and marked with the  symbol in the text editors.
Switching to debug mode
-
Download your application to a controller.
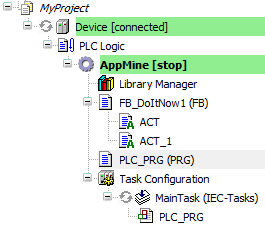
The application is highlighted in green. CODESYS and the editors of the POUs are in online mode.
-
In the POUs, set breakpoints at the locations in the code that you want to examine.
All breakpoints are listed in the “Breakpoints” view.
-
Start the application.
The application starts and the code is processed until the first breakpoint.
Now the application is in debug mode. In the device tree, the application is labeled with “[halt on breakpoint]”. The status bar provides information about the operating state:

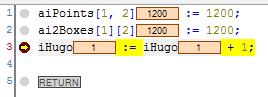
The editor was opened at the current break position. The line of code with an active breakpoint where program execution was halted is highlighted in yellow and marked by the
symbol. This statement highlighted in yellow has not been executed yet.
Now you can select the various stepping commands or display the call tree.
Alternatively, you can first start the application and then set a breakpoint.
-
See also: ⮫ Step Over
-
See also: ⮫ Step Into
-
See also: ⮫ Step Out
-
See also: ⮫ Run to Cursor
-
See also: ⮫ Set Next Statement
-
See also: ⮫ Show Next Statement
-
Behavior of the stepping command in the Debug menu