Setting element properties for the histogram
Requirements
-
A project contains a visualization object and a program.
-
A one-dimensional array is declared in the program (example:
histogram : ARRAY[1...10] OF INT;). -
In the program,
histogramdata is assigned to the array (example: within the range from0to50).
-
Double-click the “Visualization” object in the device tree.
-
In the “Visualization Toolbox” view, click “Measurement Controls” and drag the “Histogram” element to the visualization editor.
-
In the visualization editor, click the inserted “Histogram”.
The “Properties” view opens.
-
In the “Properties” view, double-click the “Value” input field in the “Data array” element property. Then click
 .
. -
In the “Input Assistant” dialog in the “Variables” category of the “PLC (PRG)” program, select the array (example here:
histogram : ARRAY[1..10] OF INT;) and click “OK”. -
To display only part of the array as a histogram, activate the “Use subrange” option and specify the index values of the array in “Start index” and “End index” to define the subrange.
-
Select the “Display type” (example: “Bar”).
-
Specify a value between
1and100(example:30) for the “Relative bar width”. -
Click the histogram in the visualization editor and change the size and position as desired.
The “Position” property changes its values accordingly.
-
Specify the values for the “Scale” element property. Select the values for “Scale start” and “Scale end” so that the array is displayed completely. For the example: “Scale start”
0, “Scale end”50.For the distance between values on the main scale, specify the value
10, for example, in “Main scale”. -
In the “Label” element property, specify the “Unit” for the display values.
-
Click “Build Generate Code”.
-
If the project has been compiled without errors, then click “Online Login” and click “Debug Start” to start the application.
The histogram is displayed in the visualization as follows:
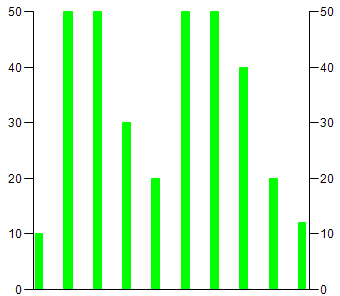
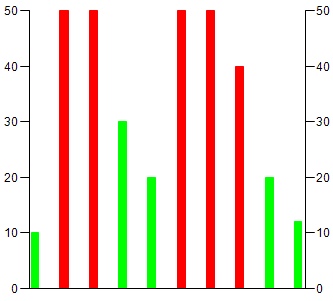
Defining alarm colors for the histogram
The visualization displays a histogram with bars all the same color (example: green).
Now you want the bars with values less than 30, for example, to be displayed in another color (example: red).
-
Click the element property “Colors Alarm color”.
-
Specify the limiting value in “Alarm value” above or below which the bars should be displayed in another color.
-
Select “More” from the list box in “Alarm condition” if all values greater than the “Alarm value” should be displayed in another color. Otherwise, select “Less”.
-
Select an “Alarm color” (example: “Red”).
-
Click “Build Generate Code”.
-
If the project has been compiled without errors, then click “Online Login” and click “Debug Start” to start the application.
In the example histogram, all bars with values greater than
30are displayed in red.