


When an application is running on the controller, the actual values of variables are displayed in the editors of the POUs. This is how the values of variables are monitored.
Requirement: The “Enable inline monitoring” option is activated in “Tools Options” in the “Text Editor” category on the “Monitoring” tab.
-
Download an application to the controller and start it.
-
Click “Debug Display Mode Decimal”.
The display format of the actual values is set.
-
Click a programming object in the “Devices” view or “POUs” view.
The respective editor opens. Actual values of the variables are refreshed continually for both the declaration and implementation.
Monitoring in the declaration editor
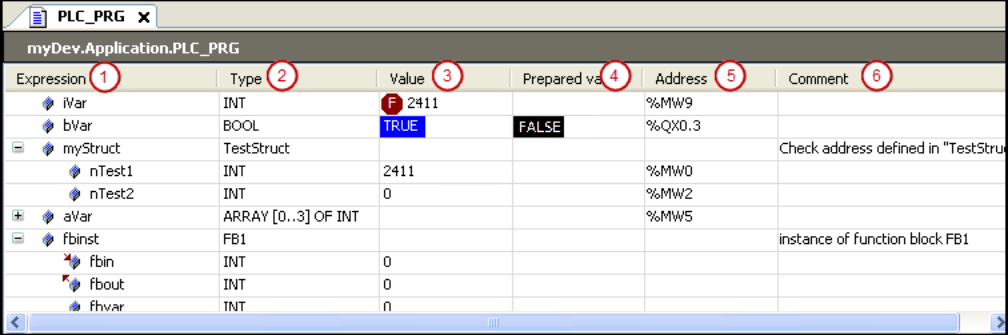
The actual value of an expression (1) is displayed in the “Value” column (3).
You can write and force a value in the “Prepared Value” (4) column. During the forcing, the actual value is decorated with a red symbol ( ).
).
The expression of an interface reference can be expanded. If the interface points to a global instance, then this global instance is displayed as the first entry below the reference. Afterwards, if the interface reference changes, then the displayed reference is collapsed.
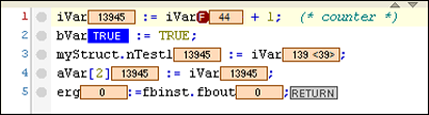
Monitoring in the implementation (inline monitoring)
Inline monitoring is the display of the current variable value in the implementation.
Depending on the implementation language, the following displays are possible in the implementation part:
-
Variables have a window with the current value displayed after their name:
If you have prepared values for variables for forcing or writing, then they are displayed in angle brackets in the inline monitoring view after the current value.
After forcing, the respective values are identified by the
symbol. -
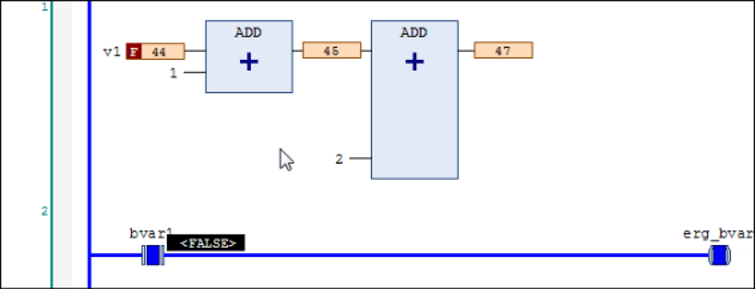
Network editors and the CFC editor:
Connecting lines are displayed in color according to their actual Boolean value (blue means
TRUE, black meansFALSE). -
LD editor:
The contact and coil elements are also marked.
For contacts and coils, a prepared value (
TRUEorFALSE) is shown in a small view next to the element. -
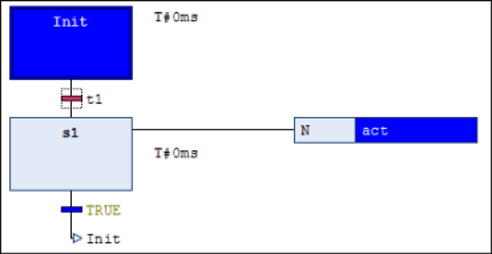
SFC editor:
Transitions with the value
TRUEare displayed in color according to their actual Boolean value (blue meansTRUE, black meansFALSE).Active steps are displayed in blue.
Forced transition values are displayed in red in the implementation.
-
IL tabular editor:
Current values are displayed in a separate column.
Monitoring in the ST editor
Monitoring in the LD editor
Monitoring in the SFC editor
You can deactivate the inline monitoring function in “Tools Options”, in the “Text Editor” category on the “Monitoring” tab.
Partial monitoring of an array
An expanded array shows the actual values for up to 1000 elements. However, this can be confusing. In addition, an array can contain more than 1000 elements. Then it is helpful to limit the range of displayed elements. You can do this in online mode in the following way.
Limiting the monitoring range
Requirement: An application is running. It contains a multidimensional array variable
with more than 1000 elements. Example: arrBig : ARRAY [0..100, -9..10, -19..20] OF INT;
-
Click in the field of the “Data Type” column for the
arrBigvariable.The “Monitoring Range” dialog opens.
-
Specify the value
[1, -9, -19]for “Start”. -
Specify the value
[1, 10, 20]for “End”.The actual values of 800 array elements are displayed in the declaration editor. The range is limited to the elements of the index
[1, <i>, <j>]with i from -9 to 10 and j from -19 to 20.
Monitoring a function block
When you double-click the editor view of a function block in online mode, a dialog opens where you can choose between viewing the basic implementation or a specific instance.
If you select the basic implementation, then the code is displayed in the editor without current values. Now set a breakpoint in the basic implementation. If the execution halts there, then the current values of the instance that is processed first in the program flow are displayed. Now you can step successively through all instances.
If you select one of the instances, then the editor opens with the code of the function block instance. The current values are displayed in the declaration and, if applicable, in the implementation, and are updated continuously.
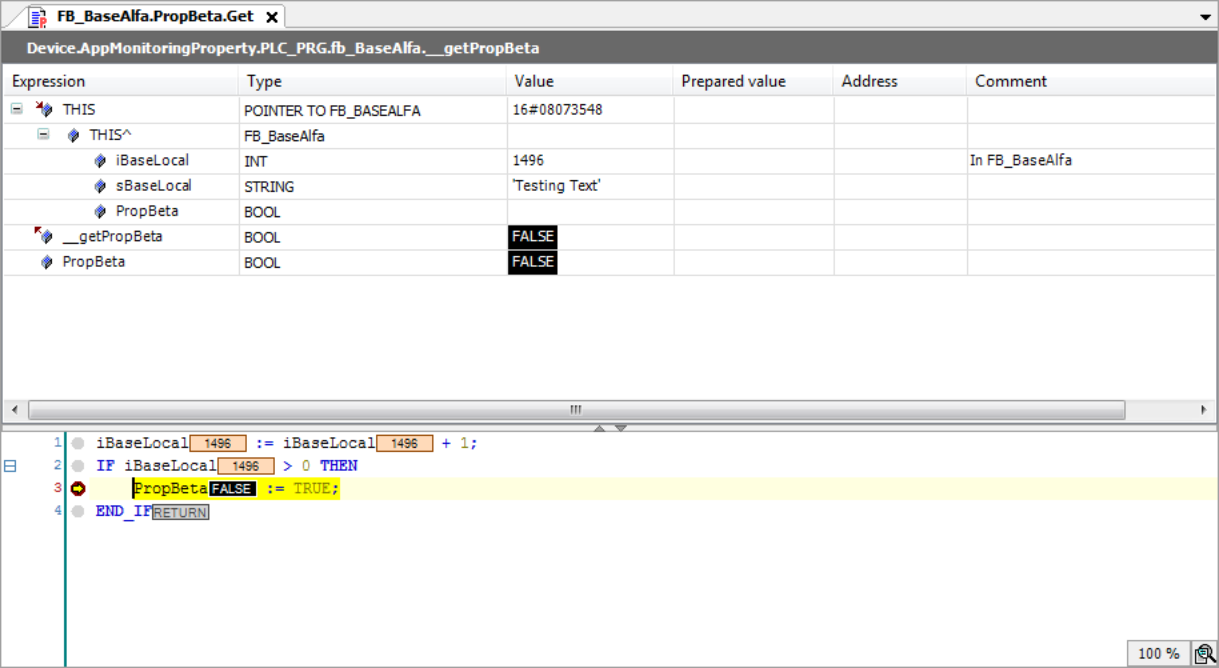
Monitoring a property
You can monitor variables in a property object  by setting a breakpoint in the function during online mode. When halted there, the
current values are displayed.
by setting a breakpoint in the function during online mode. When halted there, the
current values are displayed.
In addition to your own values, the values of the variables of the superordinate instance
are displayed automatically. In the declaration part of the property, the THIS pointer, which points to the superordinate instance, appears in the first line with
the current data type information and values.
Example
Code
FUNCTION_BLOCK FB_BaseAlfa
VAR
	iBaseLocal : INT;
	sBaseLocal : STRING;
END_VAR
iBaseLocal := iBaseLocal + 1;
sBaseLocal := 'Testing Text';

FB_BaseAlfa.PorpBeta.Get
iBaseLocal := iBaseLocal + 1;
IF iBaseLocal > 0 THEN
	PropBeta := TRUE;
END_IF

FB_BaseAlfa.PorpBeta.Set
IF PropBeta = TRUE THEN
	iBaseLocal := 0;
	sBaseLocal := 'Tested IF';
END_IF


PROGRAM PLC_PRG
VAR
	fb_BaseAlfa : FB_BaseAlfa;
END_VAR

fb_BaseAlfa();

IF fb_BaseAlfa.PropBeta = TRUE THEN
	xResult := TRUE;
END_IF
IF xReset THEN
	fb_BaseAlfa.PropBeta := TRUE;
	xReset := FALSE;
END_IF
See also
Monitoring of property access in the superordinate programming object
You can monitor the values of subordinate properties in a function block or program in addition to the variable values.
To do this, add either the pragma {attribute 'monitoring' = 'variable'} or {attribute 'monitoring' = 'call'} to the subordinate property object in the declaration. If you open the superordinate
program instance or function block instance at runtime, then the current property
values are displayed in the editor in addition to the current variable values.
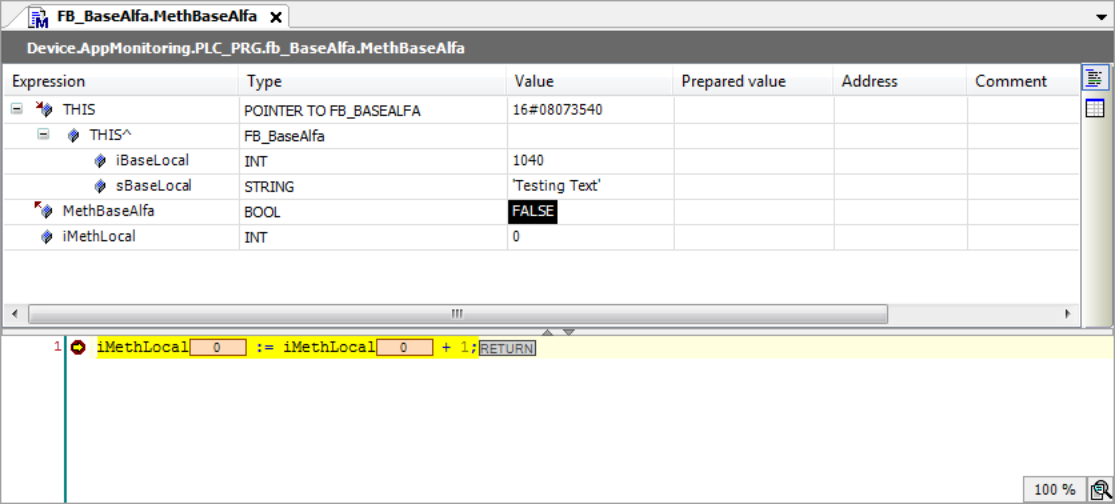
Monitoring a method
You can monitor variables in a method object  by setting a breakpoint in the method during online mode. When halted there, the
current values are displayed.
by setting a breakpoint in the method during online mode. When halted there, the
current values are displayed.
In addition to your own values, the values of the variables of the superordinate instance
are displayed automatically. In the declaration part of the method, the THIS pointer, which points to the superordinate instance, appears in the first line with
the current data type information and values.
Example
Code
FUNCTION_BLOCK FB_BaseAlfa
VAR
	iBaseLocal : INT;
	sBaseLocal : STRING;
END_VAR
iBaseLocal := iBaseLocal + 1;
sBaseLocal := 'Testing Text';

METHOD MethBaseAlfa : BOOL // Method of FB_BaseAlfa
VAR_INPUT
END_VAR
VAR
	iMethLocal : INT;
END_VAR
iMethLocal := iMethLocal + 1;


PROGRAM PLC_PRG
VAR
	fb_BaseAlfa : FB_BaseAlfa;
END_VAR
fb_BaseAlfa();
fb_BaseAlfa.MethBaseAlfa();
See also
Monitoring a function
You can monitor variables in a function object by setting a breakpoint in the function during online mode. When halted there, the current values are displayed.
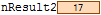
Monitoring the return value of a function call
In the ST editor of a POU, the current return value is displayed as inline monitoring at the position of the POU where a function is called.
The following conditions must be fulfilled:
-
The value can be interpreted as a 4-byte numeric value. Example:
INT,SINT, orLINT. -
The pragma
{attribute 'monitoring' := 'call'}is inserted into the function.