


You can step through an application and navigate the code. This is useful to check the status of your code at runtime. You can examine the call process, track variable values, or locate errors.
Stepping commands are provided in the “Debug” menu for this purpose. The commands become available when you set breakpoints in
online mode and then halt execution at a breakpoint: the application is in “HALT ON BP” state (debug mode). During debug mode, the current break position is highlighted
in yellow and marked with the  symbol in the text editors.
Switching to debug mode
-
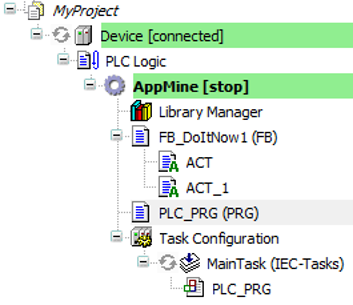
Download your application to a controller.
The application is highlighted in green. CODESYS and the editors of the POUs are in online mode.
-
In the POUs, set breakpoints at the locations in the code that you want to examine.
All breakpoints are listed in the “Breakpoints” view.
-
Start the application.
The application starts and the code is processed until the first breakpoint.
Now the application is in debug mode. In the device tree, the application is labeled with “[halt on breakpoint]”. The status bar provides information about the operating state:

The editor was opened at the current break position. The line of code with an active breakpoint where program execution was halted is highlighted in yellow and marked by the
symbol. This statement highlighted in yellow has not been executed yet.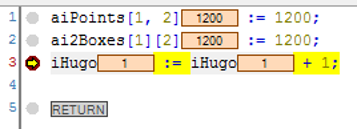
Now you can select the various stepping commands or display the call tree.
Alternatively, you can first start the application and then set a breakpoint.
Behavior of the stepping command in the 'Debug' menu
-
Command
 “Step Over”
The statement at the breakpoint position is executed. Program execution halts before the next statement in the POU.
If the statement contains a call (from a program, function block instance, function, method, or action), then the subordinate POU is processed completely in one step.
-
Command
 “Step Into”
The statement at the breakpoint position is executed. Program execution halts before the next statement.
If the statement contains a call (from a program, function block instance, function, method, or action), then the program execution jumps to this subordinate POU. The first statement there is executed and the program execution halts before the next statement. The new current breakpoint position is then in the called POU.
-
Command
 “Step Out”
The command executes the POU from the current breakpoint position to the end of the POU and then jumps back to the calling POU. Program execution halts at the calling position (in the line with the call).
If the current breakpoint position is in the main program, then the POU is run through to the end. Then the program execution jumps back to the beginning (to the program start at the first line of code in the POU) and halts there.
-
Command
 “Run to Cursor”
 First set the cursor at any line of code and then execute the command. The program is executed from the current breakpoint position and halts at the current cursor position without executing the code of this line.
-
Command
 “Set Next Statement”
First set the cursor at any line of code (also before the current breakpoint position) and then execute the command. The statement marked with the cursor is executed next. All statements in between are ignored and skipped.
-
Command
 “Show Next Statement”
 If you do not see the current breakpoint position, then execute the command. Then the window with the current breakpoint position comes into focus and the breakpoint position is visible.
Click “View Call Stack” to completely show the previous call tree for the breakpoint position currently reached in the program processing.
The “Call Stack” view shows the location of the block in the call structure of the program at all times, even before compiling the application.